TL;DR - It sets a global flag so that when the OS allocates memory in your application, it specifically sticks the allocated chunk at the end of the page, with a special no access page after each used page. Then any buffer overrun becomes immediately obvious!
What happened
We have a relatively simple standalone Windows MFC desktop app (old school) whose sole purpose is to take user inputs and call into a third party library with them. In a recent release, it started to sometimes fail to load, right on opening. It was pretty annoying and easily reproducible. It was failing fairly often - and with a debugger attached (I use Visual Studio for C++ on Windows usually) exceptions were raised that immediately suggested a memory issue. However they were not always the same (sometimes invalid access, sometimes heap corruption). A lot of the time, they were coming from the third party library, which sent me in the wrong direction for a bit but I eventually came around.
Googling and Gemini’ing around - I found some suggestions for using the Windows debugging tool GFlags (Global Flags Editor) to help sort it out. In particular, a setting called “Page Heap” was particularly useful.
If you want to install GFlags or get some more in depth info - here are the official docs. It’s a Windows debugging tool and free, you just have to install it separately.
Page Heap - what does it do?
If you’re trying to track an issue like this - where somewhere in your program some memory is being accessed beyond were is should be - Page Heap can help. There are two options, both have noticeable performance impact so they should only be used in debugging - but they are super useful for that.
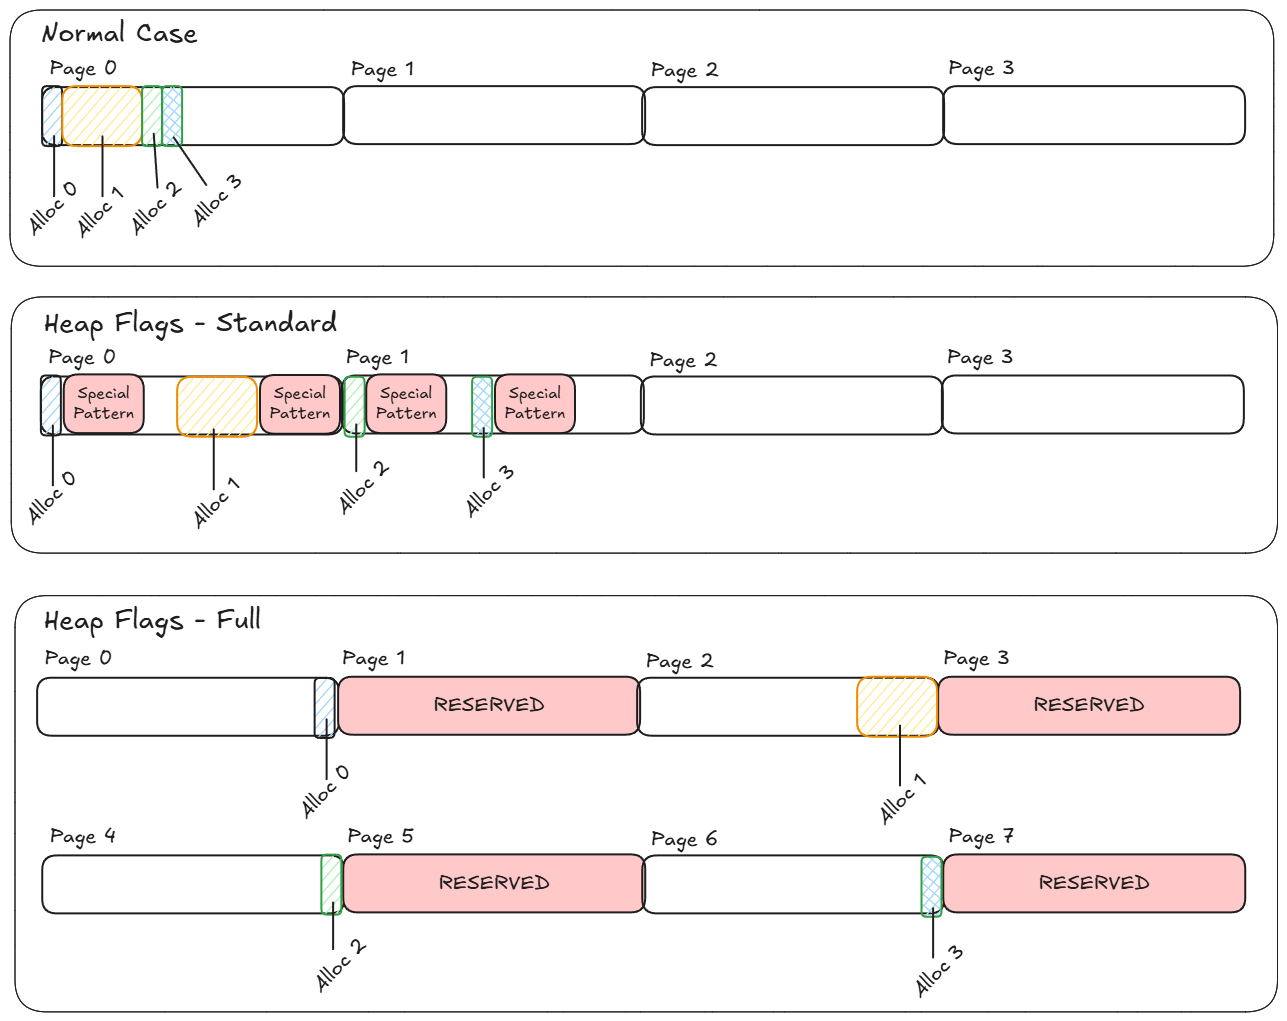
In standard mode - on each allocation, a special pattern is put in the memory directly after the allocated block. Then on free, the pattern is examined and an exception will be raised if it’s not as Gflags expected. This is the less costly option, but only helps find the culprit on free.
The full option sticks the allocation at the end of a page - and also the fills the next page with a special reserved memory at the end of each allocation. As soon as your program tries to access any part of the reserved memory, you’ll get an exception and immediately find the offending source. Of course, this is pretty heavy so depending on the program you’re testing - you might have to use standard, or you can set it up to use a hybrid where it selects full or standard randomly with some probability at each allocation. For example if you have 4kb pages, one allocation will now take up 8kb…
Here’s a way oversimplified-but-hopefully-illustrative example with a couple allocations and how the virtual pages might look:
Clearly it’s more expensive but it’s going to be very useful for finding bugs…
How did it help find a buffer overrun
In the normal case, in the wild west that is C and C++ programming (I was using a C windows API from C++) - you could take the pointer you have pointing at the valid block you have in Alloc 0, for example, in the figure above, and offset it beyond the end of Alloc 0. There are no guard rails to stop you. Sometimes you may access valid memory allocated to another block (Alloc 1 maybe) - other times, the OS might have left a free block there - or you could be trying to access the header information that tells the OS how big the block is, etc, that is stored before your pointer. In normal mode, sometimes the program works and runs completely as expected, other times it crashes with heap corruption or other memory access errors. Attaching the debugger in normal operation catches exceptions when they’re raised - but that often doesn’t correspond to where the issue actually occurs. Enter Heap Flags….
You can turn it on for your exe like this:
gflags /p /enable myapp.exe # standard
gflags /p /enable myapp.exe /full # full
Then when you run - as soon as your program accesses memory beyond where it should, it will throw there, and you find the culprit. If you use standard instead of full - you will see the error when the offending buffer is freed/deleted instead.
The flags are global when set like this for your exe so make sure you turn them off after you fix the issue:
gflags /p /disable myapp.exe
For me - the issue was that the buffer was sized incorrectly based on incorrect assumption, even smart pointers can’t help with dumb assumptions. It was actually related to a file path normalization, and the better way to handle it was to allocate the buffer to MAX_PATH to start so that there would be no way to overrun.
Why didn’t VS catch it?
I think that Visual Studio didn’t catch this in normal debug mode because it doesn’t get as aggressive. From what I understand, it does something like standard mode does, putting special patterns before and after your new/allocs and then checking them on free/delete. So like standard mode - it should get caught on clean up. Here’s an example with a deliberate overrun, run with the Visual Studio debugger attached in the default Debug config for a C++ project:
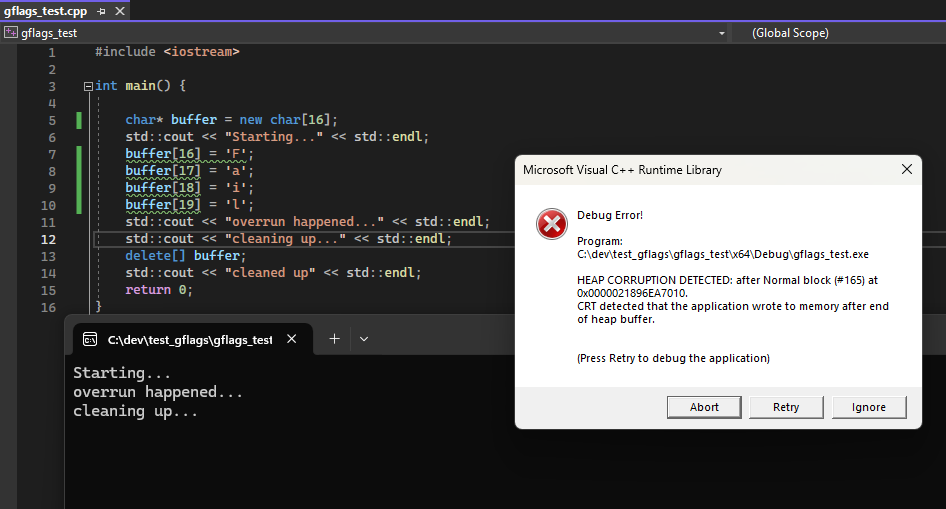
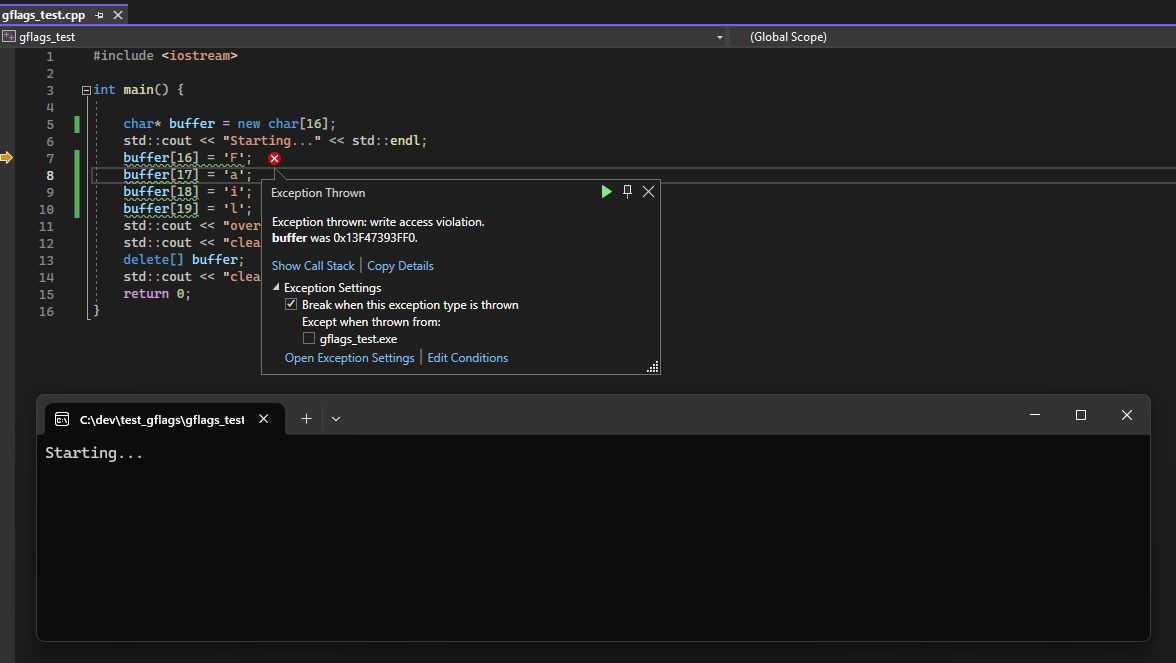
The only issue was that most of the time, in my case we were corrupting things and crashing before even getting to clean up, or failing on the cleanup of some other memory. In the toy example it’s easy to track down but in larger projects it’s harder. With Page Heap on - you immediately get a crash at the error:
Once you find the offending source code and patch the issue, you can go immediately to git blame to gather some ammo you can use to razz whichever of your co-workers introduced such a silly error… I just hope that in your case, git blame does not show you what I saw…
It’s me. Hi, I’m the problem it’s me.
Past me got me again! 🤦♂️I did it - no shade to throw unfortunately. Just need to fix it a get a new release out before any notices how silly a mistake I made. Then make sure to write a blog about it calling it out publicly.
Check out the docs for more
There are a lot more uses of Gflags in the docs - including finding use after free errors, and debugging kernel mode drivers instead of just user space programs. Writing about this because it’s a cool tool to have in the toolbox and I hope someone else gets some use from it.
In b4 - “use Rust bro” - maybe someday but right now C++ is it.
Still a little confused - what’s new
I still don’t completely understand some of the behavior even with a simple case, for example…
On the large “real” project - this all worked as expected:
- *Page Heap: OFF - Release and Debug both crashing - crashing in ‘random’ stops or on free/delete
- Page Heap (full): ON - Release and Debug both crashed right at the error
In the small toy example I created to play with for this post - some buffer sizes and overrun “offsets”:
- Overrun not actually detected by the VS debugger on free/delete
- Detected at the source of overrun with Page Heap (full): ON
- Detected at the source of overrun with Page Heap (standard): ON (this was not expected)
For other values - I saw both Page Heap options seem to miss the overrun at the source, and instead catch it at clean up like the normal debugger.
Here’s a toy example:
#include <iostream>

int main() {
    /*
	  16 - (expected) caught a overrun with Page Heap on
	       and caught by VS debugger in clean up.
	   8 - (unexpected?) VS debugger misses it but Page Heap
	       on (either mode) catches at overrun
    */

    char* buffer = new char[16]; // 16 expected failures
    std::cout << "Starting..." << std::endl;
    buffer[16] = 'F';
    buffer[17] = 'a';
    buffer[18] = 'i';
    buffer[19] = 'l';
    std::cout << "overrun happened..." << std::endl;
    std::cout << "cleaning up..." << std::endl;
    delete[] buffer;
    std::cout << "cleaned up" << std::endl;
    return 0;
}
Current guesses:
- If you write past the size of the “test pattern”, VS code won’t catch it –> The VS debugger seems to be really reliable at catching on clean up when it’s an overrun near the end of the block (probably the most common situation) - so off by one or near to it seems to really reliably get caught at clean up. If you access memory further from the end of the allocated block it stops catching it (there - in a real program you’ll probably corrupt something else and catch that - and be confused - but also clued into there being something wrong).
- Sometimes - maybe depending on the size, the allocation could be not all the way aligned to end exactly at the end of the page. If there’s some gap between the current page and the special reserved page, you could get a way with writing outside of the bounds - and then it’s only chance is it to catch that the memory that shouldn’t have been touched has been modified on clean up like in standard mode.
- And finally - I don’t have a good guess for how Page Heap (standard) could cause it to crash at the source of the overrun yet.
If you understand this better or have any ideas, I would love to learn!